Some links below are affiliate links. They cost you nothing extra, I only recommend things I run myself, and the recommendation would be the same without them.
On 5 August one of my sites stopped answering. Not slowly: at all. curl sat
there for over 200 seconds and received zero bytes, no error page, no timeout
message, nothing. Another site on the same VPS, same CyberPanel install, same
OpenLiteSpeed, answered in 1.79 seconds.
I run seven sites on a VPS with CyberPanel and OpenLiteSpeed, including numroq.com, a PHP 8 application with a separate API backend. This is what was actually wrong, written down while it was fresh.
The cause turned out to be three unremarkable defaults stacked on top of each other, none of which is a bug, and all of which assume that work always finishes. This is what they were, how I found them after chasing two wrong theories first, and the limits I put on them.
Slow and stuck are different faults
Slow work finishes. A request that returns nothing after two or three minutes is not slow, it is waiting on something that has no deadline, and no amount of tuning fixes a missing deadline.
You can tell them apart with one command:
curl -o /dev/null -s -w 'ttfb=%{time_starttransfer} total=%{time_total}\n' https://example.com/
A slow site gives you a large ttfb and a slightly larger total. A stuck one
gives you ttfb=0 with a total in the hundreds. Zero time to first byte means
nothing ever started coming back, which points at a process that is blocked
rather than one that is working hard.
That single number saved me an hour on the second day and cost me an hour on the first, because I did not run it until after I had already started guessing.
Three checks that name the layer
Before touching anything, find out which layer is at fault. Each of these rules out a whole layer, so do them in order and stop at the first one that fails.
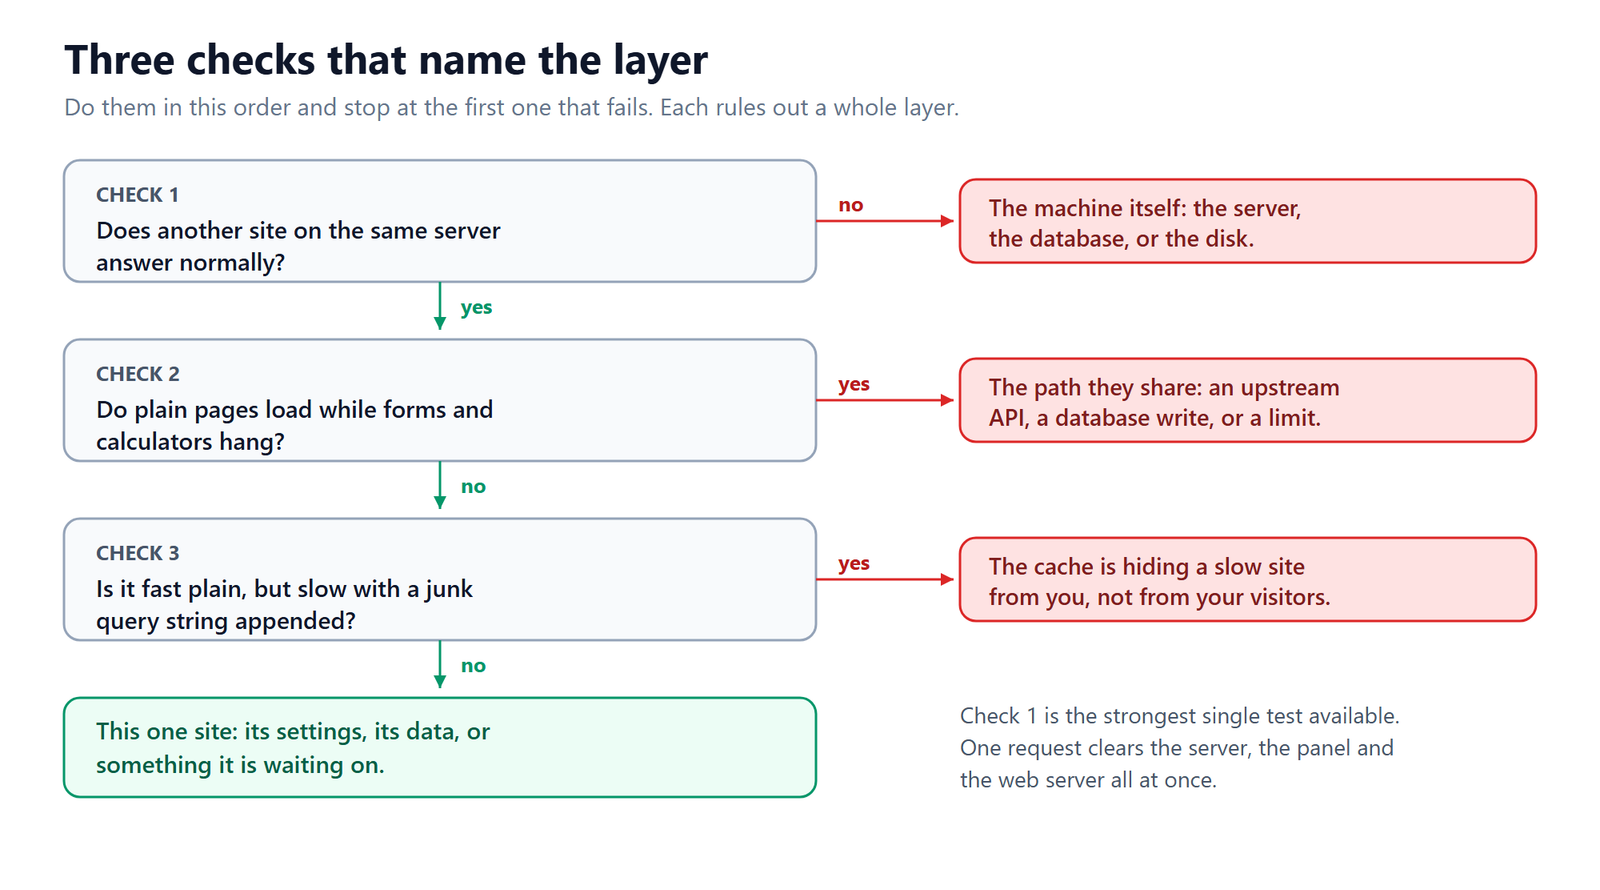
Does another site on the same server answer normally? If yes, then the machine, CyberPanel and OpenLiteSpeed are all working, and the fault belongs to one site. This is worth doing first because it is the cheapest test you have and it eliminates the three layers people usually blame. If you host only one site, add a static HTML file under a second domain and keep it there. It costs nothing and it will pay for itself the first time you need it.
Do plain pages load while forms and calculators hang? Then the fault is in the path they share: an upstream API, a database write, or a limit. If everything hangs equally, go back to the machine.
Is the site fast normally but slow with a junk query string appended? Then the cache is serving you a fast page and hiding a slow site. Test in a private window, and remember that logged-in requests usually skip the cache entirely, which is why a site can look fine to you and be unusable for visitors.
One warning that cost me real time: do not measure through your own rate limits. My application allows a set number of API calls per minute per address. Testing repeatedly tripped it, and the refusal I got back had nothing to do with the fault I was investigating. It looked like a symptom. It was me.
A VPS, then a panel on top
A control panel installs on a machine you control, so the server comes first. You need root, enough memory for a headless browser, and snapshots you can roll back to. Any provider works. Mine is a Hostinger VPS with CyberPanel on it, which is why that is the pair I can speak for.
- Root access, install anything
- Memory for Chrome and FFmpeg
- Snapshots and one-click restore
- CyberPanel Core is free on top
Affiliate link. It costs you nothing extra and this site's server is one.
The two theories I got wrong
I am including these because the wrong turns are the useful part, and because both are easy to fall into.
Wrong theory one: the wrong server. A week earlier the same site had appeared to roll back a month. Users gone, posts gone, an old version number in the footer. I spent hours in the panel and the database before checking DNS, where the root record still pointed at my old shared host through a CDN alias. Two copies of the site were live, both accepting traffic, and I had been editing one while looking at the other.
The lesson is a command, not a principle. Before diagnosing anything, prove which machine is answering:
curl -sI --resolve example.com:443:YOUR.VPS.IP https://example.com/ | head -1
If that differs from what a plain request returns, stop. Nothing else you find will make sense until they match, and flushing your local DNS cache first rules out the one explanation that costs nothing to eliminate.
Wrong theory two: a database lock. For the hang itself my first conclusion was MySQL metadata locks, and I shipped a change based on it. The application log disproved it the next morning: there had been exactly one request in the window, and it had returned 201. A single successful request cannot exhaust a lock. I had built a plausible story and then stopped looking, which is the failure mode worth naming, because it feels exactly like progress.
What was actually happening
The site generates PDF reports. Some of them call a language model, which can take minutes, and then render the result through headless Chrome. Here is the sequence.
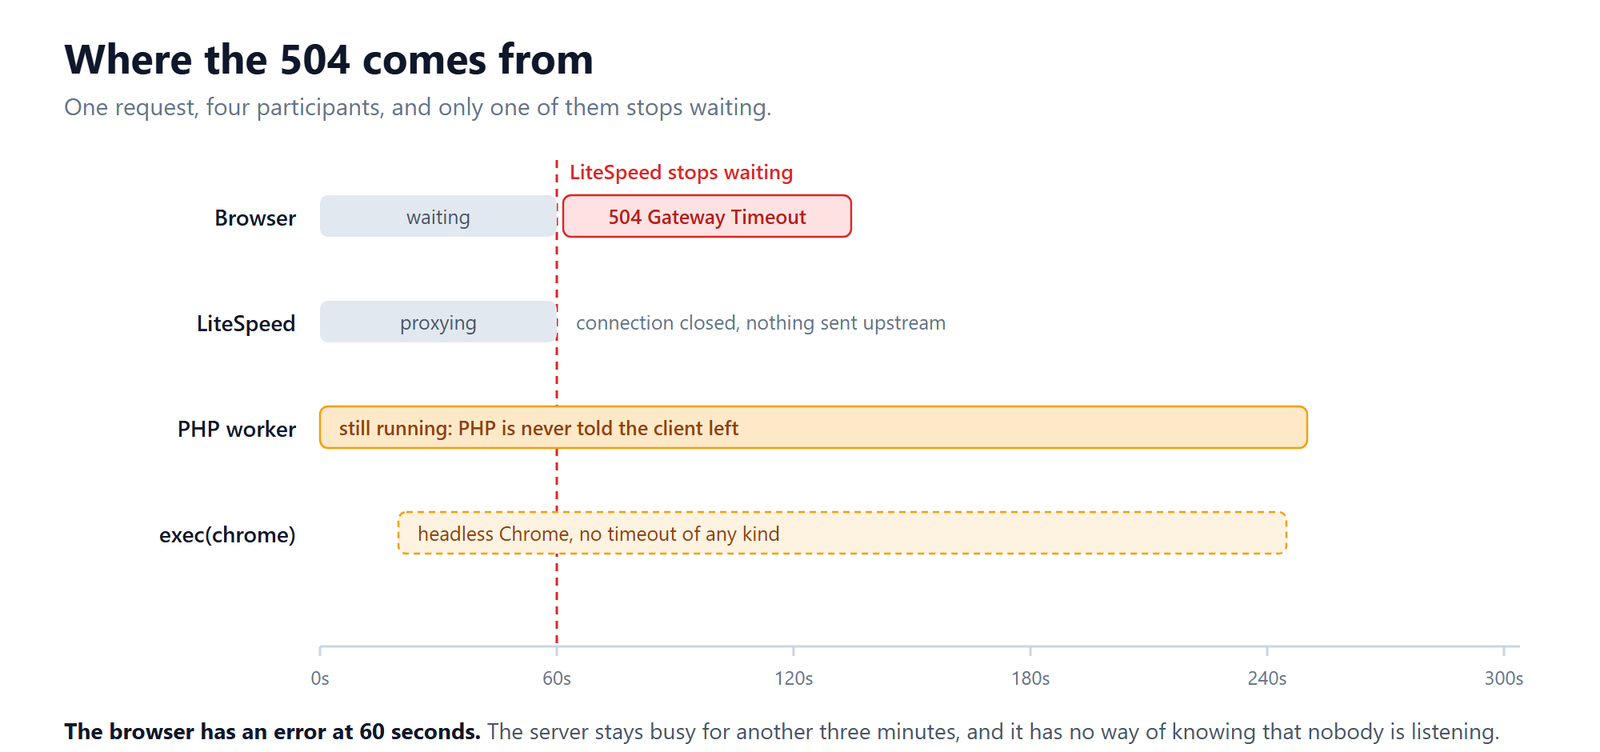
A request arrives and LiteSpeed hands it to a PHP worker. The worker starts the report, which waits on the model, then calls headless Chrome to render it. LiteSpeed waits for the external application only as long as its configured timeout allows, and then it gives up and returns 504 to the browser.
The worker does not stop. This is the part that surprises people, so it is worth being precise about why. PHP only discovers that a client has disconnected when it next tries to write output, which is exactly what its connection handling documentation describes. A script that spends four minutes calling an API and shelling out to a renderer writes nothing during that time, so it never finds out that there is no longer anybody to write to. It finishes the whole job, in full, for an audience of nobody.
And exec() cannot help, because it has no timeout parameter at all. There is
no argument you can pass it. The call returns when the child process decides to
return, and if that child is a browser waiting on something, it may not decide
for a very long time.
Why trying again is the worst thing you can do
The visitor sees a gateway error, which every instinct reads as "that failed, try again". So they try again.
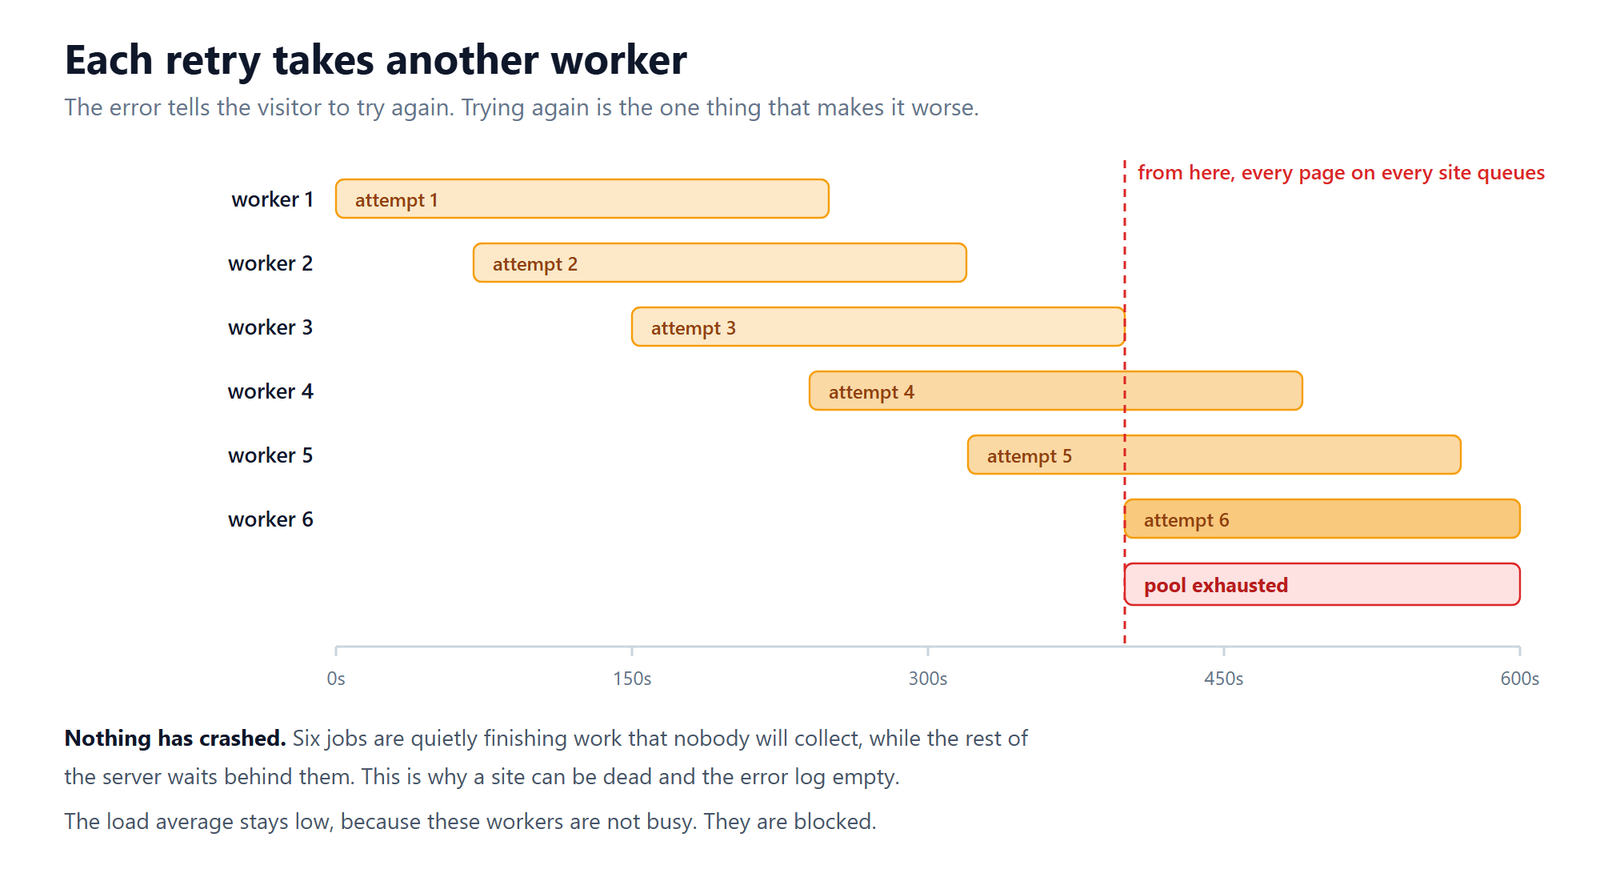
Each attempt takes another worker for the full length of the job. Your PHP worker pool is finite, and it is shared. Once enough of those workers are held, there is nothing left to serve ordinary pages with, and every site in that pool starts queueing behind jobs whose results will be thrown away.
This is why the symptom is so confusing. Nothing has crashed. The error log is empty, because nothing has errored. Load average is low, because blocked processes do not consume CPU. Memory looks fine. Every health and performance dashboard says the server is fine, and the site is dead.
If you take one operational habit from this article, take this one: when a long-running job returns a gateway error, wait and check whether the work completed before you retry. In my case the reports were finishing and downloading correctly the whole time.
Giving each one a deadline
Three defaults, three limits.
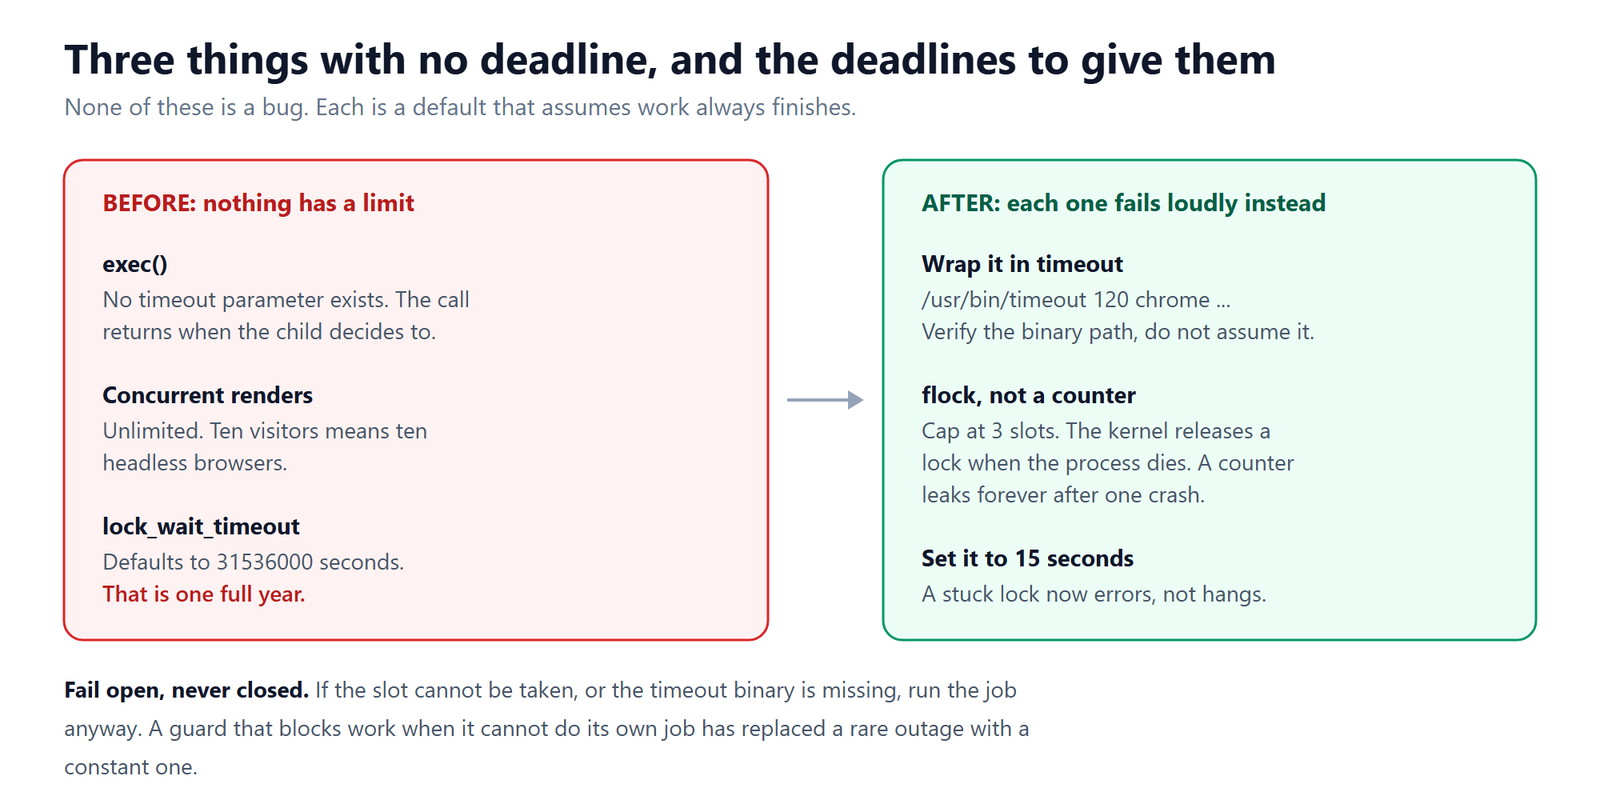
Wrap every external command in timeout. Since exec() will not take a
deadline, put one in front of it:
/usr/bin/timeout 120 /usr/bin/google-chrome --headless ...
timeout(1) is part of
coreutils, so it is already on your server.
Verify that the binary exists and is executable before you build the command,
rather than assuming a path. I originally detected it with command -v timeout
and discovered during testing that on a system without it, the failure produced
a command line that silently rendered nothing at all. Check for an absolute,
executable path, and if it is not there, run the job unwrapped.
Cap concurrency with flock, not a counter. Limit how many renders may run
at once, and enforce it with lock files rather than a number in the database. The
difference matters: when a process dies, the kernel releases its lock
automatically, while a counter that was incremented and never decremented leaks a
slot forever. One crash, and your limit is permanently smaller. After enough
crashes it is zero, and your feature is dead with no error to explain it.
Cap lock_wait_timeout. MySQL's default
is 31536000 seconds, which is one
full year, and it applies to metadata locks. That is the kind of lock an
interrupted schema change or a forgotten open transaction leaves behind, and it is
worth reading alongside ordinary
query performance tuning,
because it is not a slow query and tuning will not find it. With the
default in place, a query that hits one does not fail, it waits, effectively
forever, and takes its worker with it. Set it to something a human would tolerate:
SET SESSION lock_wait_timeout = 15;
SET SESSION innodb_lock_wait_timeout = 15;
Fifteen seconds turns a permanent hang into an error you can read in a log.
Size the pool per site. CyberPanel gives every site its own PHP-FPM pool, which is a genuine advantage here, because it means one site's stuck workers cannot starve another site. It only works if you use it. Check the pool settings for each site rather than leaving them all identical, and give the site that runs long jobs enough headroom that a few blocked workers still leave something to serve pages with.
Fail open, never closed
Every guard above has to fail in the safe direction.
If the slot cannot be taken, run the job anyway. If the timeout binary is
missing, run the command without it. If the lock file directory is not writable,
proceed. A guard that refuses to let work happen when it cannot do its own job
has replaced a rare outage with a constant one, and it will do so quietly, on the
day you are not watching.
Capture the evidence before you reboot
A reboot clears blocked processes and stale locks, so it usually fixes this, and it also destroys every trace of what caused it. Before you restart anything:
SHOW FULL PROCESSLIST;
ps aux | grep lsphp | wc -l
df -h
Running query list, worker count, free disk space. Thirty seconds of copying and pasting, and the difference between fixing it once and fixing it every few weeks.
The short version
- A request that returns nothing is blocked, not slow. Check time to first byte.
- Test a second site on the same server before you suspect the server.
- Prove which machine is answering with
curl --resolvebefore you diagnose. exec()has no timeout. Wrap it intimeoutand verify the binary path.- Use
flockfor concurrency limits, because the kernel cleans up after a crash and a counter does not. lock_wait_timeoutdefaults to a year. Set it to fifteen seconds.- Do not retry a long job that returned a gateway error. Check whether it finished.
- Capture the process list before you reboot.
None of this is exotic. It is four defaults that were written for work which always ends, applied to work that sometimes does not.